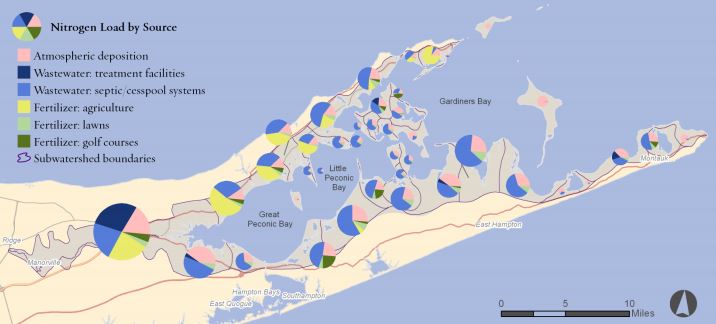
Nitrogen load by source for 43 subwatersheds...
Nitrogen load by source for the 43 subwatersheds of the Peconic Estuary. This map excludes direct deposition to the water surface. The size of each pie chart indicates the relative size of loading compared to other subwatersheds. Figure from Nitrogen load modeling to forty-three subwatersheds of the Peconic Estuary- Stephen Lloyd, 2014.
Additional Information
| Field | Value |
|---|---|
| Data last updated | October 13, 2026 |
| Metadata last updated | October 13, 2026 |
| Created | October 13, 2026 |
| Format | JPEG |
| License | No License Provided |
| Datastore active | False |
| Has views | True |
| Id | ac903361-bb64-448a-ad2c-8b0b218d4806 |
| Mimetype | image/jpeg |
| Package id | 43e5a8cd-0908-4fb6-a421-a2f747a311c9 |
| Position | 33 |
| Size | 39.2 KiB |
| State | active |
| Url type | upload |